

The Three Curves of Regenerative Transition
A soy farmer from southern Brazil just challenged one of the biggest myths in regenerative agriculture. He’s right.

“It’s not a J-curve. Never was.”
Marco doesn’t look like someone who spends time reading white papers on regenerative agriculture. He’s a soy farmer from Rio Grande do Sul, southern Brazil, pragmatic, direct, and deeply skeptical of anything that sounds like it was designed in a conference room.
When I sat down with him last year, I expected to hear the usual story: the hard years, the financial pressure, the slow recovery. The J-curve narrative that the industry repeats almost universally when talking about the transition to regenerative practices.
He stopped me before I even finished the sentence.
“It’s not a J-curve. Never was, not for me, not for most of the farmers I know here in the south.”
I pushed back. The J-curve is well-documented. Productivity dips before it recovers. Costs rise before they fall. That’s the transition.
Marco shook his head.
“That’s one transition. Not all of them. It depends on where you start and how big the change is. We didn’t collapse. We improved, gradually, steadily, without drama.”
He was right. And that distinction, which sounds almost technical, has enormous consequences for how capital flows into regenerative agriculture, and how programs succeed or fail.
What Marco saw before the agronomists did
Marco’s farm didn’t start transitioning because of a program, a subsidy, or a sourcing requirement from a European buyer. It started because he was paying close attention to what was happening on his land and he didn’t like what he saw.
“The soil was tired. I could feel it. You work the same land for thirty years, you know when it’s giving you less than it should.”
He began reducing chemical inputs gradually. Not dramatically, no overnight conversion, no ideological commitment to a certification. Just a methodical reduction in fungicides, insecticides, and synthetic fertilizers, replaced by biological inputs, cover crop rotations, and better soil management.
The results didn’t come in the shape most people expect.
“We didn’t fall and then recover. We improved consistently. Small steps, but always forward. And then something started happening that I didn’t plan for.”
Animals returned to his land. Species he hadn’t seen in years birds, insects, small mammals. The trees on the edge of his fields began showing fungal networks at their roots, visible signs of soil biology recovering. His input costs dropped significantly over three years, not just slightly, but enough to change the financial structure of his operation.
“I stopped needing government credit lines. I stopped being afraid of interest rates. That changes everything about how you think about your farm.”
That last sentence landed harder than anything else in our conversation. Financial independence, not yield, not carbon credits, not ESG compliance, is what Marco describes as the most transformative outcome of the transition. A farm that doesn’t depend on chemical packages, bank financing, or government subsidies is a fundamentally different business. It’s a resilient one.
Why Marco’s experience doesn’t contradict the science, it completes it
Marco is not an outlier. And his transition was not easier or more fortunate than others. It followed a different curve, because it started from a different position, with a different scope of change.
The shape of a regenerative transition is not fixed. It is determined by two variables: the farm’s current productive state (high or low) and the scale of change being introduced (controlled and incremental, or broad and systemic).
Those two variables produce three distinct transition curves. Each one is real. Each one is valid. But they are not interchangeable, and treating them as if they were is one of the most expensive mistakes in regenerative program design.
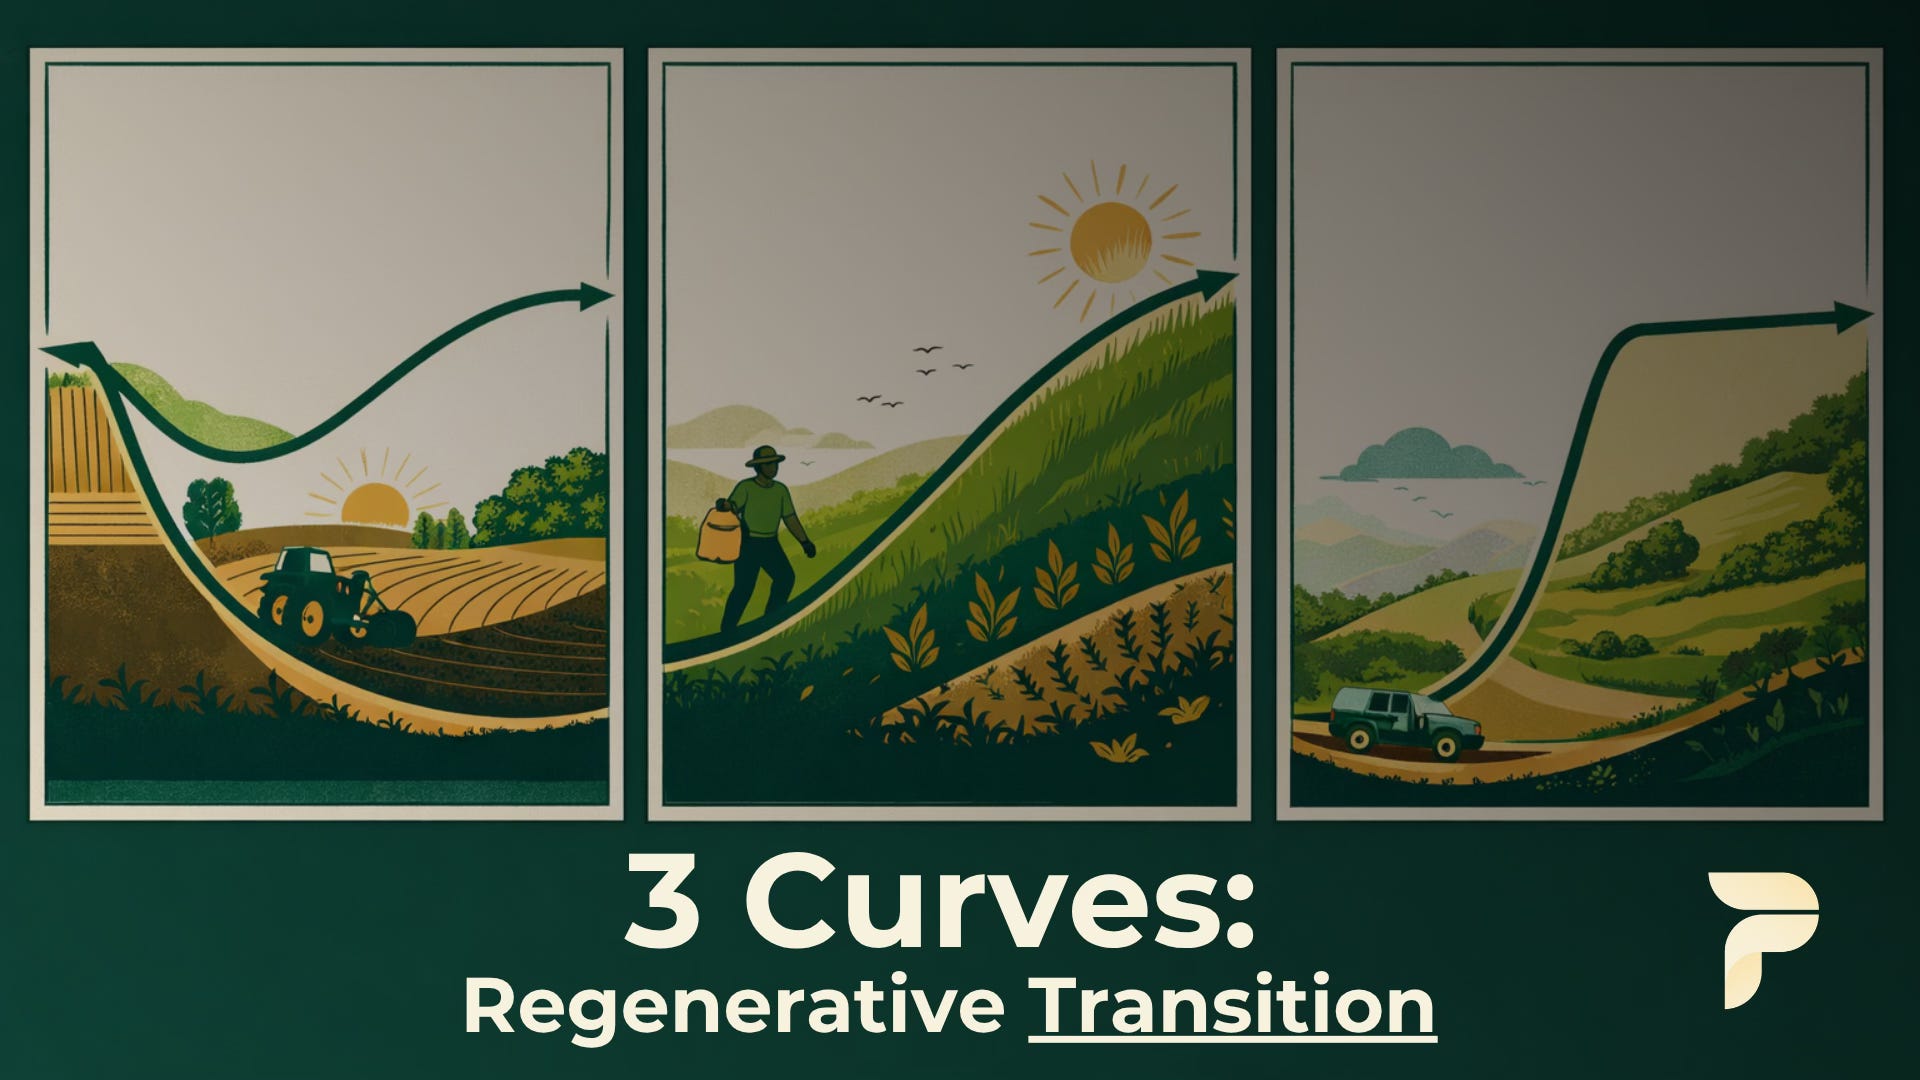
The three curves
Curve 1: Linear - High productivity, controlled change
This is Marco’s curve. And it is the most underestimated one in the industry.
A Brazilian soy or corn producer with a strong baseline, good soil management, some precision agriculture, no-till already in practice, can introduce regenerative changes in isolation. One cover crop rotation tested on a specific plot. One reduction in fungicide application monitored over a season. The productive system is resilient enough to absorb the experiment without total disruption.
The transition here is linear because the learning is modular. Each change is contained, measurable, and reversible if needed. Productivity doesn’t collapse because the system has enough biological capital to buffer the shift.
For capital architects, this curve offers the lowest risk profile, but it also requires a different investment logic. The value here is not in rescuing a failing system. It is in accelerating the diffusion of validated practices across a large, already-functional base. The error most programs make is over-engineering financial incentives for farmers who are already moving, and under-investing in the knowledge infrastructure that would let them move faster.
Curve 2: J-Curve - High productivity, systemic change
Marco’s curve is not universal. And he would be the first to say so.
An European farmer adopting no-till from a conventional tillage baseline is not making one change. They are making a systemic shift, in equipment, seed genetics, weed management, soil biology, and agronomic decision-making, simultaneously. The productive system has no biological buffer to absorb this. Productivity will fall. Costs will rise. The farmer will face their most difficult season at precisely the moment when the program needs them to stay committed.
This is the J-curve. It is real, it is documented, and it is the dominant transition curve in contexts where the gap between current practice and regenerative practice is large.
The problem is not the curve. The problem is that most programs are not designed to support farmers through the valley. Capital structures built around 12-month cycles and output-based KPIs are structurally incompatible with a biological system that takes 24 to 36 months to stabilize. Farmers don’t abandon these programs because they lack conviction. They abandon them because the architecture fails them at the worst possible moment.
For founders designing programs in European markets, or in Brazilian contexts involving significant systemic change, this is the most likely terrain. It demands dense technical support, multi-year financial commitment, and go/no-go decision points anchored to agronomic milestones, not calendar dates.
Curve 3: Accelerated → Plateau - Low productivity, systemic change
This curve looks like success. Early and fast.
In degraded pastureland, common across the Brazilian Cerrado, Caatinga, or heavily eroded areas of Brazil, the baseline is so depleted that almost any intervention produces visible improvement. Introduce cover crops, rotate livestock, add organic matter, and the system responds within one growing season. Farmers see results quickly. Programs celebrate early wins.
But those early gains are structural recovery, not transformation. The system is rebuilding minimum biological function, it is not yet regenerating at scale. Once it crosses that threshold, the easy wins stop. The curve flattens. Programs that were celebrated for rapid impact suddenly look stagnant, and the temptation is to conclude that the approach has stopped working.
It hasn’t. The system has simply entered a new phase, one that requires a different kind of investment. Patient capital, deeper agronomic intervention, and a longer time horizon to unlock the next level of performance.
For capital architects, this curve demands a two-phase investment thesis: fast-moving capital for the acceleration phase, and patient capital for the plateau transition. Most fund structures are optimized for one or the other. Rarely both.
The quadrant you should avoid
There is a fourth combination worth naming briefly: low productivity and small-scale, controlled change. This quadrant rarely justifies the program design effort. The system is not productive enough to generate meaningful learning from incremental experiments, and the upside is too limited to attract serious capital. If your program is operating here, redesign before you deploy, not after.
What changes when you know your curve
Marco’s farm is not a case study in regenerative agriculture’s potential. It is a case study in what happens when the scope of change is calibrated to the productive state of the system, even if that calibration happened intuitively, without a formal framework.
His animals came back. His trees recovered their fungal networks. His input costs fell substantially, not marginally. And he achieved something most regenerative agriculture programs never mention as a goal: financial independence. No government credit lines. No bank interest. No dependency on the next chemical package from a distributor.
That outcome is not available on every curve. It requires starting from a position of productive strength, introducing change at a pace the system can absorb, and staying consistent long enough for the biology to do its work.
For capital architects: the diagnostic question before committing capital is not “is this farm transitioning?” It is “which curve is this program on, and is our capital structure designed for that specific curve?”
For AgFood founders and CEOs: your program assumptions are probably built for the linear curve, because it is the most legible and the easiest to model. But your highest-impact sourcing contexts operate on the J and the accelerated curve. Designing for the wrong one is not a minor miscalibration. It is a structural misalignment between your program and the biological reality it is trying to change.
The takeaway
Marco was right. The J-curve is not the universal story of regenerative transition. It is one story, determined by where you start and how big the leap is. Know your curve before you design your program. Know your curve before you deploy your capital.
The biology will not wait for you to figure it out in year two.
Designing a regenerative sourcing program or deploying capital into agricultural transition? Let’s map which curve you’re on, before the program launches.